
I weigh the strongest warning as being when shipments from a chip supplier increase more than sales or consumption downstream. This happens as distributors or customers build inventory and delay orders. I put more weight on this than any single ratio in inventory. A legitimate sale can bring an order forward that wouldn’t be needed the next quarter.
Before you put that growth rate into a forecast, learn whose shelves are filling and where the company stops measuring demand. The costly error is thinking owning a company with rising inventory is the worst that could happen. It’s owning a company with rising and durable inventory when customers have already purchased enough chips to skip their next order.
Follow the chip past the first sale
The supplier’s balance-sheet inventory tells you about chips it still owns, not chips already sold to distributors or components waiting at an equipment manufacturer, often called an OEM, or its contract manufacturer. Those are three separate inventories. A lean supplier warehouse can coexist with crowded shelves downstream.
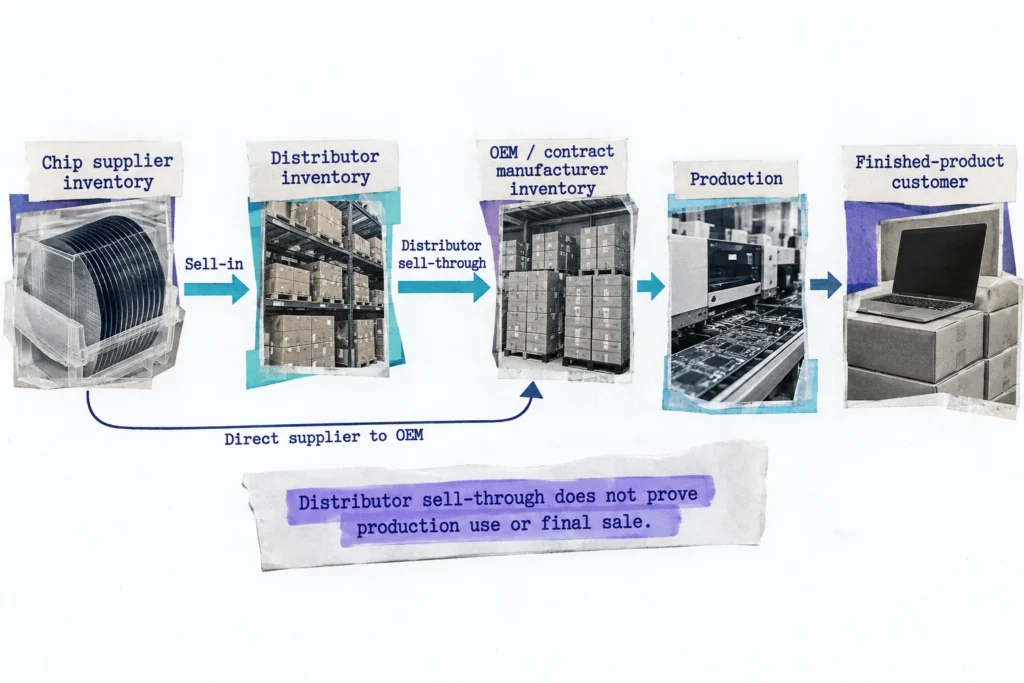
Suppliers sell to distributors (sell-in) and distributors sell to customers (sell-through). The second sale provides evidence, but an OEM may still stockpile components rather than use them in production and production can leave unsold finished goods. Relying on a sell-through policy, I want to know where the measurement stops.
Imagine I’m updating a revenue forecast with an earnings release beside a filing. I find an assuring number in the inventory section. However, the number is concerning, and the release focuses on distributors. I’m working on the wrong number and have the wrong chips in my spreadsheet. I pause the forecast and separate the chips before drawing a conclusion.
A distributor’s total inventory won’t help here either. Avnet has supplier agreements that can stipulate stock rotation, returns, and price protection, so consolidated stock cannot be assigned to one chipmaker. Channel disclosures by suppliers can be useful, but only if the product, region, and reporting period aligns with the shipments you’re looking at.[6]
How flat consumption can produce a growth headline
It’s simple arithmetic; ending downstream stock equals beginning downstream stock plus shipments minus consumption. Here’s a hypothetical combined downstream pool where all quantities are stated in units. For the purposes of this example, combining the locations helps simplify the analysis. In your actual research, keep the locations separate.
| Period | Beginning stock | Supplier shipments | Consumption | Ending stock |
|---|---|---|---|---|
| Normal supply | 20 | 100 | 100 | 20 |
| Inventory build | 20 | 120 | 100 | 40 |
| Inventory digestion | 40 | 80 | 100 | 20 |
Shipments grow 20% during the build, then fall 33.3%, from 120 to 80, during digestion. Consumption never changes. At a constant hypothetical price of $1 per unit, supplier revenue follows the same path. That’s why a shipment correction can look much worse than the underlying demand change, and why the preceding growth can look much better.
There are good reasons to build stock: a launch needs chips available when the product arrives, seasonal demand requires preparation, and unreliable supply can justify a larger buffer. Alpha and Omega Semiconductor identifies seasonality, product introductions, and distributor ordering changes as factors affecting its results. I’m less concerned by a build with a concrete purpose and a plausible consumption timetable than by one explained only as “strong demand.” Later disclosures still need to show the stock being used. Even a sensible one-time buffer increase isn’t recurring growth.[8]
Microchip: the warning was visible before the correction
Microchip reported its June quarter 2023 results on August 3, 2023, showing revenue of $2.289 billion, up 16.6% over the same quarter the previous year. The results showed slower sell-through in China and an accumulation of inventory by Chinese distributors. Backlog orders were pushed out. Management’s assessment of the results stated that while revenue was reported, the channel was weak and warranted a concern in China.[1]
Its accompanying filing showed distributor inventory of Microchip products rising to 29 days from 24 days at March 31. That remained within its disclosed historical range of approximately 17-40 days. I wouldn’t let “within the range” erase the more specific warning: an aggregate measure can look ordinary while a region is accumulating unwanted stock.[2]
What could you conclude then? Extrapolating 16.6% growth deserved less confidence. You couldn’t calculate the share pulled forward, predict the correction’s duration, or conclude that revenue was improperly recognized. Public disclosures didn’t provide a complete supplier-specific inventory count across distributors and customers.[1][2]
Later results showed the vulnerability. December-quarter revenue was $1.766 billion, down 18.6% year over year, with a 63.4% GAAP gross margin and 37 days of distributor inventory. March 2024 revenue fell to $1.326 billion and GAAP gross margin to 59.6%. Management then said it believed shipments were below end-market demand as customers and channel partners reduced stock, and described reduced factory utilization.[3][4]
Later disclosures tend to confirm an inventory digestion explanation of the weakness, however, they do not isolate that explanation from potentially weaker end demand. Under-shipment estimates are not measurements of end-market demand. It was clear with hindsight that there was a supply chain correction. That does not turn August’s partial data into a clear-cut forecast.[3][4]
What the accounting ratios can, and can’t, tell you
Days of inventory can corroborate the theory of the case, but can’t necessarily locate it. The formula for calculating inventory is average inventory ÷ quarterly cost of revenue. Because inventory is carried at cost, compare it to the cost of revenue as well as sales, and use consistent time periods and the company’s definitions. An declining cost of revenue can push inventory days up, while inventory doesn’t increase a dollar.
This was evident in Microchip’s numbers as well. Supplier-owned inventory was approximately $1.31 billion at December 31, 2023 vs. $1.32 billion at March 31. Additionally, days of inventory on-hand rose from 169 to 185. These are the reported numbers by the company, not the numbers we have calculated.[3]
Receivables expanding faster than revenue is worth examining, as is increasing days sales outstanding (DSO), which is calculated as average receivables divided by revenue, with the result multiplied by the number of days in the period. However, factors like payment terms, when shipments are made at the end of a quarter, the customer mix, and if there have been advance payments or factoring, can all impact the comparison. Microchip has disclosed arrangements with distributors, as well as factoring, and that’s something I’d want to review before I accepted weak demand as an explanation. I wouldn’t count normal collections as consumption. A customer could pay for chips they won’t need for a long time.[3][5]
There is a difference between a valid sale and repeatable demand. Microchip’s fiscal 2026 accounting policy generally recognizes semiconductor revenue when control transfers on shipment, with adjustments for distributor concessions and return rights. Therefore, an economic pull-forward doesn’t necessarily mean that there has been a manipulation of the semiconductor revenue, and the policy of another semiconductor supplier also needs to be evaluated.[5]
Rising industry charts don’t necessarily answer the question either. The Worldwide Semiconductor Trade Statistics (WSTS) data that the Semiconductor Industry Association (SIA) uses to publish its estimates are more broadly based on shipments, not on independent final consumption. Growth in dollar values can be a result of a change in product or price mix. That can give context, but it doesn’t answer if a supplier’s customers are using chips.[7]
Put the order pause into the valuation
Assume for the moment that revenue is consumed, and inventory is not, and adjust for price, product mix, and margin. In our scenario, assume for the moment a 60% margin: $120 of revenue would represent a $72 margin. With digestion, the price would fall to $80, representing a $48 margin, or $40 at a 50% margin. The difference in margin is due to inventory, not shipment.
For a manufacturer, lower utilization means fixed costs are distributed over fewer chips. Discounts or inventory write-downs reduce margins. With a fabless supplier, costs are mostly in design and marketing. Microchip’s later utilization commentary shows one possible mechanism; it doesn’t explain its overall margin pressure.[4][5]
What would make you comfortable with your forecast? Sell-through data or production-use data for the same time periods, and improving stock coverage, would also be helpful. Pushing out shipments to the second half of the year would be comforting. Persistently weak sell-through with high coverage and push-outs would cause me to decrease my shipment assumptions. Decreasing inventory levels wouldn’t impact my assumptions, as inventory can be reduced due to normal consumption or due to a material decrease in demand.
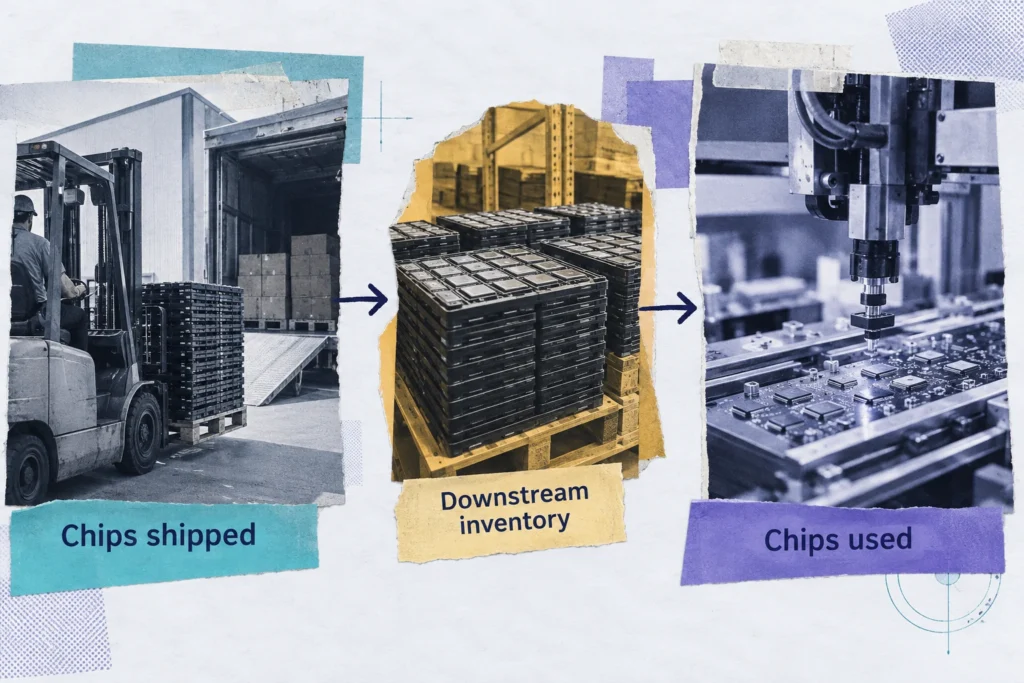
If customers’ stock remains undisclosed, the pulled forward share also remains unknown. You can still test different shipment pauses and see if the valuation remains defensible with a slow recovery and reduced near-term earnings. I would prefer to leave the chips unexamined than give a precise percentage the disclosures can’t justify.
Sources and references
- Microchip Technology: Microchip fiscal Q1 2024 earnings release (2023-08-03)
- Microchip Technology: Microchip 10-Q for the quarter ended June 30, 2023 (2023-08-03)
- Microchip Technology: Microchip 10-Q for the quarter ended December 31, 2023 (2024-02-01)
- Microchip Technology: Microchip fiscal Q4 2024 earnings release filed as Exhibit 99.1 (2024-05-06)
- Microchip Technology: Microchip fiscal 2026 Form 10-K (2026-05-21)
- Avnet: Avnet fiscal 2026 Form 10-K (2026-08-14)
- Semiconductor Industry Association: Semiconductor Market Data
- Alpha and Omega Semiconductor: Alpha and Omega Semiconductor fiscal 2026 Form 10-K
