
Measure two things before buying the second ETF: how much their company weights overlap, and what does your proposed combination actually own? Do consider company drivers. I consider all three, as a purchase can spread your money across more companies while putting more of it behind the semiconductor cycle.
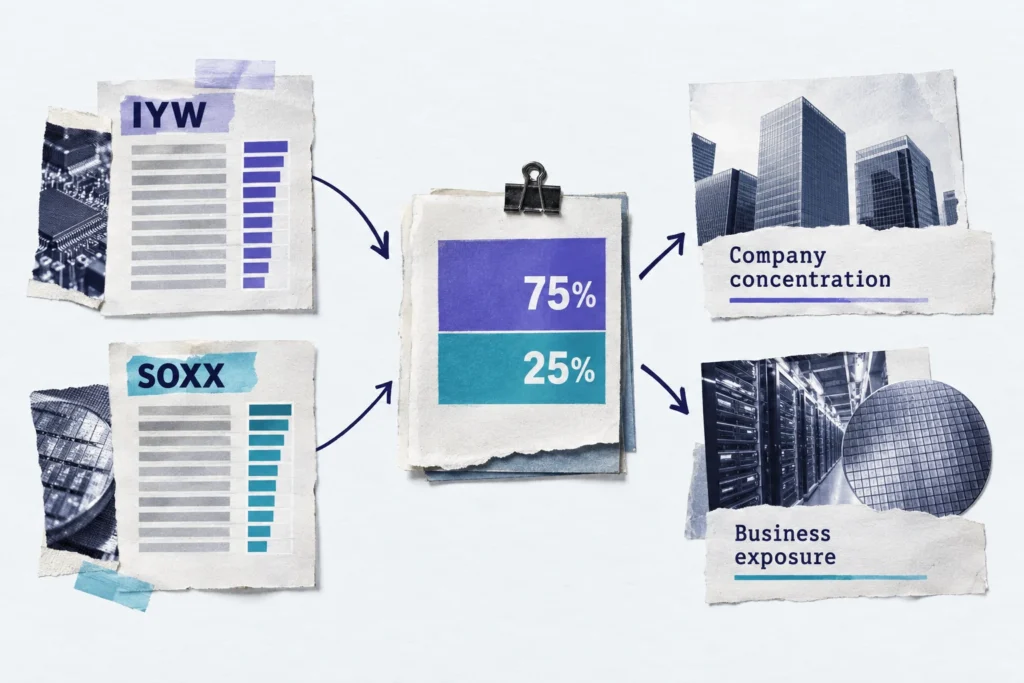
Consider IYW, the iShares U.S. Technology ETF, and SOXX, the iShares Semiconductor ETF. Using October 7, 2026 holdings, their weighted company overlap is approximately 30.32%. Yet a hypothetical 75% IYW/25% SOXX technology sleeve lowers top-ten company concentration while raising semiconductor and equipment exposure. That’s a tradeoff, not a blanket diversification win.[1][2][4][5]
Start with matching holdings, not matching labels
Full holdings files are available for each issuer. Download these files for the same date, not just the ten largest holdings. The links to “latest holdings” will change, so using a later date may not produce the same example. Comparing different dates will capture differences between securities, price changes, and portfolio changes.[1][2]
In this example, treat all cash and equity holdings the same. Securities should be equated first, then companies. Matching based on ticker can be misleading. Companies should be equated first, then Securities. Enter zero for companies not held.[1][2]
I’ve left cash, collateral and derivatives in the issuer’s original fund weights. Therefore, equity columns need not add to 100% (they haven’t been silently rescaled). Both files include futures with a reported zero market-value weight but positive notional exposure. A zero in that column does not imply zero economic exposure. So, looking through those contracts would be necessary for a complete exposure comparison; this is a pure cash and equity comparison.[1][2]
The smaller weight is the overlap
For each company, take the smaller of its two fund weights and add those smaller weights together. A spreadsheet with fund weights in columns B and C would have each row’s contribution as =MIN(B2,C2). Sum that column. Counting shared companies would give a small position the same importance as a dominant position.[3]
| Calculation | Inputs | Result |
|---|---|---|
| Nvidia’s contribution to overlap | Smaller of 17.28% in IYW and 7.48% in SOXX | 7.48 percentage points |
| Total company overlap | Sum of the smaller weight for every company | Approximately 30.32% |
| Nvidia in the proposed sleeve | 0.75 × 17.28% + 0.25 × 7.48% | 14.83% |
| SOXX-only companies in the proposed sleeve | 0.25 × 14.68% | Approximately 3.67% |
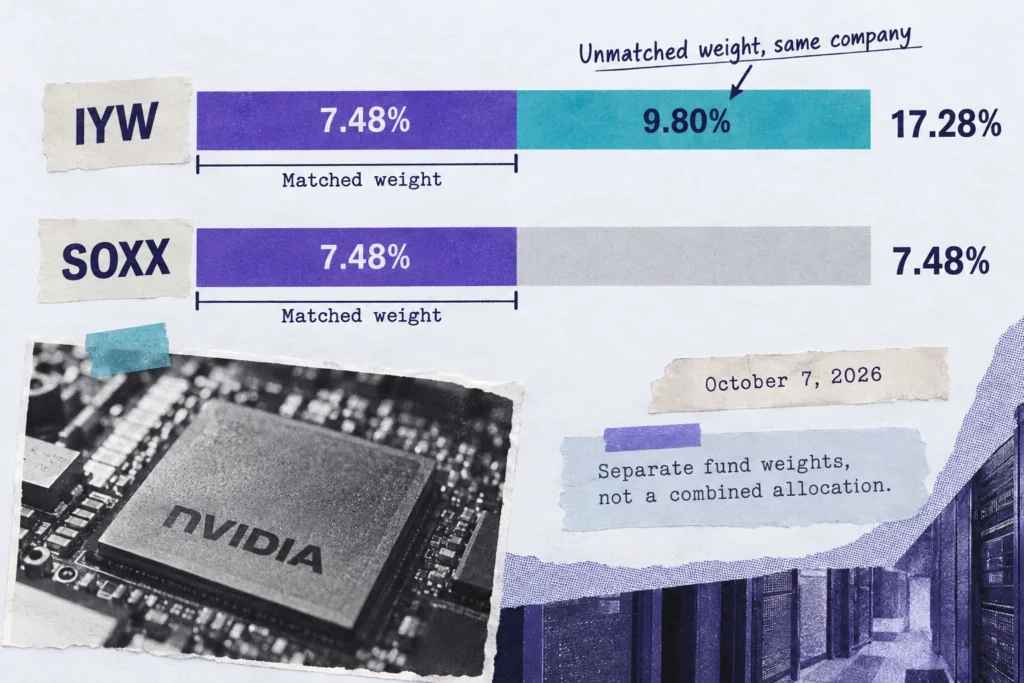
It’s tempting to say the remaining 69.68% is “new companies,” but this is not the case. For example, the additional 9.80 percentage points for Nvidia in IYW is still Nvidia exposure. To determine truly new companies, we would sum SOXX’s weights where IYW’s company weight is zero. This is approximately 14.68% of SOXX, or 3.67% of this overall combined sleeve.[1][2]
Picture me, in an imagined example, with two holdings downloads open and a spreadsheet proudly displaying “69.68% different.” I’m pleased until I notice Nvidia sitting in both columns at different weights. The label suddenly feels too generous. I replace it with two separate calculations: unmatched weight and companies I don’t already own. Less impressive wording, much more useful information.
Calculate the portfolio you’d actually hold
It’s important to consider overlaps with both funds, not with your allocation. For each company in the hypothetical sleeve, calculate 0.75 × its IYW weight + 0.25 × its SOXX weight, and then find the largest to smallest combined company weights. Don’t average the funds’ top-ten concentration figures, as the combined portfolio may have a different top ten.[1][2]
Company-Aggregated Top-Ten Concentration falls from ~66.51% in IYW to ~61.00% in the Combination. Nvidia falls from ~17.28% to ~14.83%. While these numbers reflect a reduction in company concentration, they do not necessarily correlate with lower volatility or smaller future drawdowns.[1][2]
Looking at the same date issuer sector breakdowns, for IYW this is ~40.97% Semiconductors and Equipment, and ~55.69% for the Combination. With this, we can say this purchase shifts predominant company weights and enhances a chip industry tilt. Saying this purchase is more “diversified” is misleading.[4][5]
Different companies can still depend on the same spending
SOXX and IYW cover different segments of the semiconductor value chain. SOXX covers semiconductor manufacturers, designers, and equipment companies. IYW focuses more on manufacturers. Adding another company to SOXX may not necessarily cover a new segment of demand.
SOXX’s prospectus mentions demand cycles and capacity. Adding another company in SOXX may not cover a new source of demand.[7]
I’d also want to know about cloud customers slowing capital spending, weakening enterprise software budgets, or rising discount rates impacting growth stock valuations. These are things to analyze, not observed correlations. Industry categorizations don’t determine a company’s dependence on cloud or AI revenue, and no matched total-return correlation study has been completed for this example. Low holdings overlap does not address how two funds will behave similarly.
The snapshot can move, and the fees need weighting too
Look beyond today’s weights to the index’s admission rules: its eligible market, industry definition, and listing requirements. Those rules shape which companies can enter. IYW’s index applies quarterly company capping, but its prospectus allows weights to exceed those constraints between reviews. A cap at a review date isn’t a daily ceiling.[6][8]
SOXX’s prospectus describes U.S.-listed eligibility. An issuer methodology summary, based on December 31, 2025 information, describes annual reconstitution, quarterly reweighting, and capping. The current ICE methodology wasn’t retrieved for this comparison, so I wouldn’t present that older summary as proof that every cap remained unchanged in October 2026. Recalculate after relevant reviews rather than treating 30.32% overlap as permanent.[7][9]
Fees: they are simply weighted by your allocation. The expense ratios for IYW and SOXX, listed in the prospectuses supplied, are 0.37% and 0.33%, respectively. The hypothetical sleeve has a cost of 0.75 × 0.37% + 0.25 × 0.33% = 0.36%, not 0.70%. That’s roughly $36 annually per $10,000 at constant value and allocation, excluding spreads, commissions, taxes, and other costs.[6][7]
For intentional smaller positions in dominant companies and more exposure to semiconductors, this combination is moving in the direction you intend. If you want less dependence on the chip cycle, it moves the wrong way, even though the top ten shrink. Use your broad market funds and direct holdings to reduce exposure, if you deem it prudent, to take judgment in applying this to your whole portfolio. I’d buy the second fund for a change I can name, not for the relief of seeing another ticker.
Sources and references
- BlackRock / iShares: IYW full holdings CSV, October 7, 2026 (2026-10-07)
- BlackRock / iShares: SOXX full holdings CSV, October 7, 2026 (2026-10-07)
- University of Notre Dame / Martijn Cremers: Active Share explanation and calculation
- BlackRock / iShares: IYW issuer product page
- BlackRock / iShares: SOXX issuer product page
- iShares Trust, filed with the SEC: IYW summary prospectus, August 31, 2026 (2026-08-31)
- iShares Trust / BlackRock: iShares prospectus including SOXX, July 31, 2026 (2026-07-31)
- FTSE Russell / LSEG: FTSE Russell Capping Methodology, version 5.4, September 2026 (2026-09)
- BlackRock / iShares: iShares Sector & Sub-Industry ETFs methodology summary
