
Give credit for the value of the AI infrastructure spending when the cash flows expected from those spending justify their full cost. When compared to the cash generated from the existing business, this year’s budget is significantly lower. The company doesn’t disclose specific project level returns. I’ll check the assumptions that need to work: realized pricing, operating costs, utilization, timing of deployment, and when they are retired.[4][5]
Imagine I’m looking at an earnings release with a spreadsheet open beside it. Cloud growth looks terrific, but my “investment return” cell divides total operating cash flow by the latest infrastructure spending. That neat percentage bothers me. Old businesses supplied the numerator, new assets supplied the denominator. I delete it and leave the project return blank. An honest blank beats a persuasive mismatch.
Microsoft's cash tells you about funding, not a new GPU's return
For the quarter ended June 30, 2026, Microsoft reported consolidated operating cash flow of $55.434 billion, with cash purchases of property and equipment of $35.802 billion, leaving $19.632 billion, in line with management’s rounded $19.6 billion free cash flow figure. While that is positive evidence of funding capacity, it’s not an AI investment cohort return, as the cash is from a broad business and a wide range of assets spanning many years.[2][3]
Management's broader quarterly capex figure was $41 billion, including $5.6 billion of finance leases. Roughly two-thirds went toward short-lived assets, primarily CPUs and GPUs, across AI and non-AI infrastructure. I wouldn't force those rounded figures into an exact reconciliation with cash purchases: acquiring an asset and paying for it aren't necessarily events in the same quarter.[2]
The lease footnote matters here. Finance-lease additions bring assets onto the books without an equivalent upfront cash purchase, while finance-lease principal payments sit in financing cash flow, outside the operating-cash-flow-minus-cash-purchases calculation. Operating-lease payments and finance-lease interest already reduce operating cash flow. Subtract those again and you'll charge the business twice.[1]
There are other expenses that have not cashed-flow through the statement. At June 30, Microsoft had $26.7 billion of PP&E purchases remaining in accounts payable and $34.6 billion of construction commitments. Not all of the funds have been paid. Construction in progress means cash is tied-up and will be released upon completion of the construction. Capital expenditures (Capex) do not include the costs of construction. For your analysis, compare cash payments, construction in progress, capital expenditures, and commitments separately.[1]
The distinction can help interpret an otherwise positive headline. Microsoft disclosed that more of its future leases for data-center construction would be classified as operating leases, as opposed to finance leases. This would reduce its expected reported capital expenditures for the year ending 2026 to approximately $175 billion. However, expected capital expenditures would be the same. Therefore, I would want to know how Microsoft classifies leases before making an investment decision.[2]
Follow paying work, not installed capacity
Microsoft's Intelligent Cloud revenue was $39.3 billion for the quarter, up 32%. Azure and other cloud services grew 43%. Strong figures for revenue growth, but they don't tell us about the cash flow for the recent AI assets. The footnotes and other disclosures we reviewed didn't provide a clean AIOps vs. replacement spending analysis or an investment cohort cash flow analysis. I can credit the revenue growth without assuming we've measured the return on the growth.[1][2][3]
When evaluating the rented compute, focus on economically billable use as opposed to machines running. Use what customers actually pay after discounts and service credits. The rate card is irrelevant. You make money when the compute fills up, not when the compute is running. A full data center is still a disappointment if it required severe discounts to fill it. Capacity is not cash, the opportunity is.
For internally used AI infrastructure, I'd look for incremental subscription cash, better retention, or genuine cost savings attributable to the investment. That's a harder connection to establish than a compute-rental bill. Total software revenue won't answer it, especially if the new service merely moves customers from an older product. What matters is the cash the company wouldn't have earned without this spending.
What would have to happen for $100 million to earn its keep?
Let's put numbers on that connection with a hypothetical equipment investment, not a Microsoft estimate. You pay $100 million today for four earning years, with zero disposal proceeds. At full billable utilization, annual revenue is $100 million and usage-linked cash costs are $40 million. Both scale with utilization in this example. Fixed cash costs, including facility charges, are $8 million annually. We'll assume no additional working capital or capital spending during those four years and use an illustrative 10% pre-tax discount hurdle.
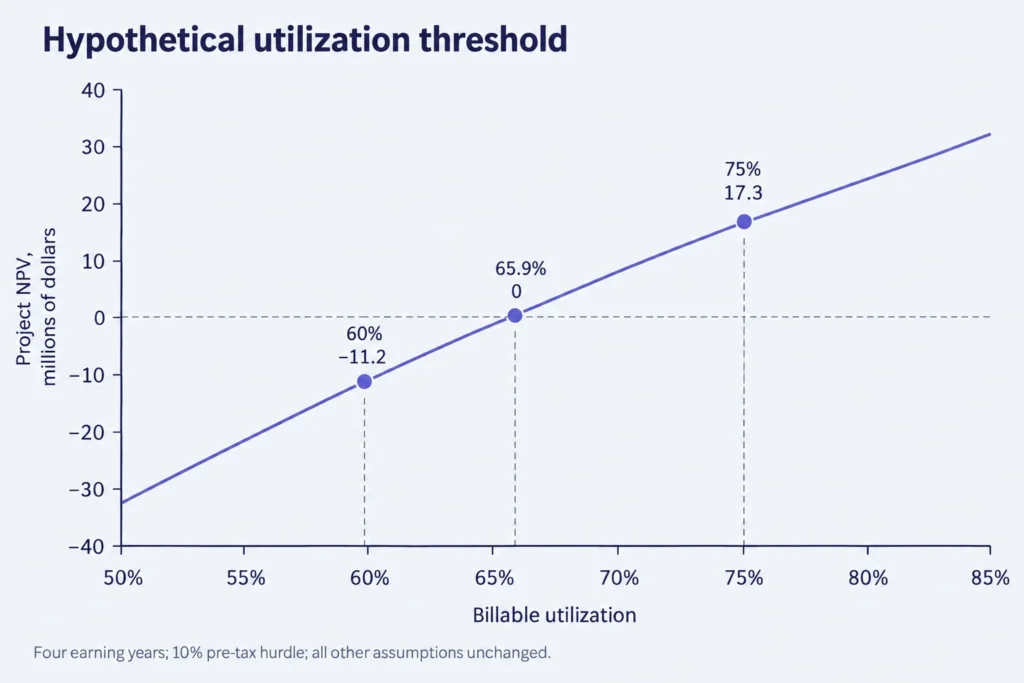
At 75% utilization, annual pre-tax operating cash is 0.75 × ($100 million, $40 million), $8 million = $37 million. The four year-end receipts have a present-value factor of approximately 3.1699 at 10%, so net present value is NPV =, $100 million + $37 million × 3.1699 = approximately +$17.3 million. Again, this represents the value created by the project, not simply saying total cash flows would exceed the project cost.[4]
| Scenario | Annual operating cash | Project NPV |
|---|---|---|
| Base: 75% utilization, four years | $37.0 | +$17.3 |
| Utilization falls to 60% | $28.0 | , $11.2 |
| Realized pricing falls 10%; usage costs unchanged | $29.5 | , $6.5 |
| Deployment delayed one year; all four earning years preserved | $37.0, received in years 2-5 | +$6.6 |
| Economic life falls to three earning years | $37.0 | , $8.0 |
I would say break-even utilization is a more useful number. To recover $100 million at our hurdle, the project needs $100 million ÷ 3.1699, or about $31.5 million of annual operating cash. Add the $8 million fixed cost and divide by the $60 million full-utilization contribution: ($31.5 million + $8 million) ÷ $60 million gives approximately 65.9%. If you're assuming 75% utilization, you know what you need to support, and the effect a pricing concession would have. Price, utilization, and productivity can all improve together.
The delay case gives the project a fairly generous second chance: all four earning years survive, just one year later, with no extra carrying costs. Fixing a contract end date or technological obsolescence can eliminate an earning year, and continuing rent during the delay can reduce the available cash still further. "The same cash later" is a better assumption than "less time to earn it."
Replacement changes what shareholders get to keep
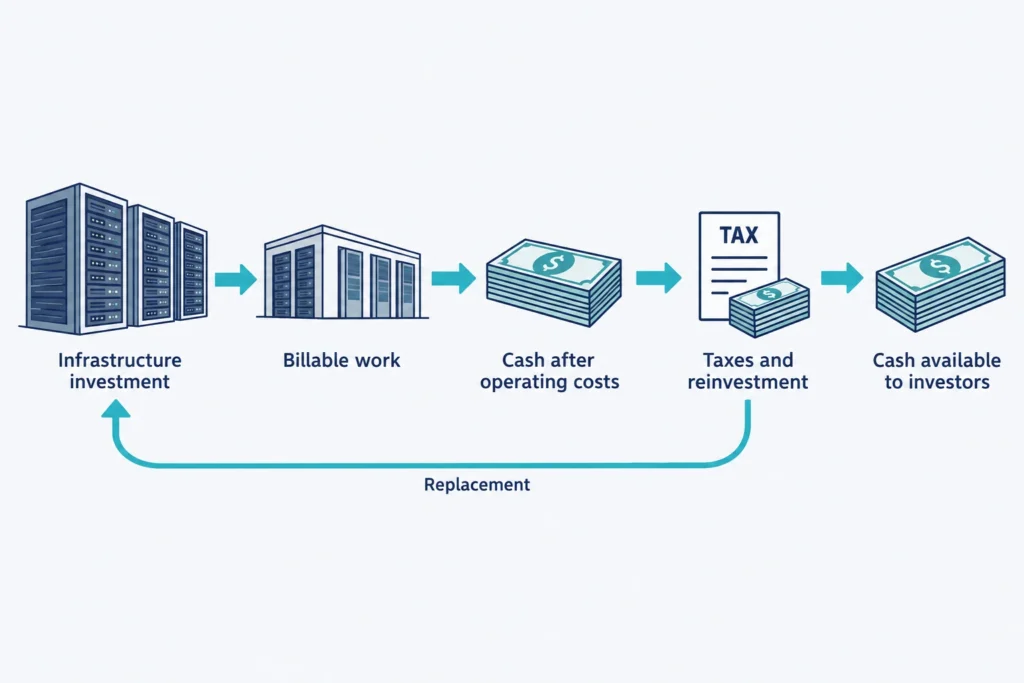
The project's growth is tied to capacity-expanding investments, and replacement investments preserve earning capacity. Typically, replacement investments can also enhance capacity or reduce unit costs. I wouldn't consider a budgeted depreciation charge as an automatic replacement budget. Depreciation is a noncash charge, and the economic question is at what point does the equipment no longer earn a competitive return and what is the cost to replace it.[4][5]
We assume the project has an infinite life, and stops earning after it's expected life. If we want to forecast an ongoing business, we have to assume equipment is ultimately replaced and forecast the value of the replacement. Without replacement, we'd be extending the $37 million forever. We also can't charge an explicit replacement payment and a replacement reserve. Different assumptions should be made for the economic lives of buildings, power systems, and processing equipment.[4]
This example shows how things work prior to tax. To actually compute an after-tax return, you need to account for cash taxes, tax depreciation, working capital, continuing commitments, and project financing. I would also omit financing from the project calculation if the discount rate is considered to be a project hurdle. At that point, the debt and any leases that are classified as financing would be moved to equity. Cash after financing and an equity discount rate can be used if desired. However, both approaches should not result in double counting the claim on cash from a lease.[4]
Of course, there is the additional consideration of what you are paying for those returns? A positive project NPV won’t make a stock ‘cheap’ if the stock price is already factoring in higher utilization, firmer pricing, and repeated expansion. The disclosures Microsoft made for the June quarter suggest funding capacity more than AI cohort returns. I’ll provisionally give expansion credit based on cash flows, replacement and financing, as opposed to the size of the check. The stock only looks attractive when every single operating assumption is factored right? In that case I’d keep it on the watchlist.[1][3][4][5]
Sources and references
- Microsoft Corporation / SEC EDGAR: Microsoft fiscal 2026 Form 10-K (2026-07-29)
- Microsoft Corporation: Microsoft fiscal 2026 fourth-quarter earnings call (2026-07-29)
- Microsoft Corporation: Microsoft fiscal 2026 fourth-quarter earnings release (2026-07-29)
- Aswath Damodaran / NYU Stern: Cash Flows
- Aswath Damodaran / NYU Stern: The Fundamental Determinants of Growth
