

A leveraged technology ETF’s daily reset means it compounds a multiple of each day’s benchmark return, not a multiple of the benchmark’s entire multi-month return. A 3x label therefore doesn’t turn an expected 10% quarterly index gain into a promised 30% gain. Depending on the daily returns along the way, compounding can lift the result above 30% or leave it far below that.[1][4]
Imagine I’m comparing funds with a three-month forecast open beside the order screen. I type "index +10%, fund +30%," and notice the word "daily" in the objective. The word "daily" turns my neat chart/spreadsheet irritatingly incomplete. I edit the forecasts to be daily. With the edits, I can now treat the number as useful.
Same destination, very different gains
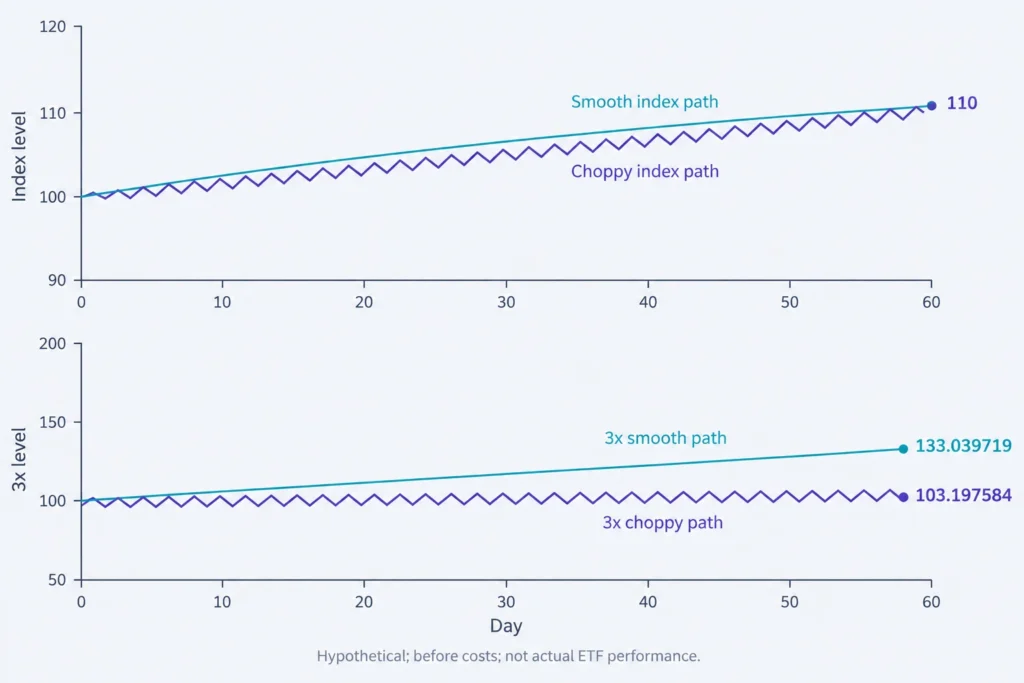
Here’s a controlled comparison over 60 trading days, roughly three months. The hypothetical indexes start at 100 and end at 110. Each idealized 3x investment starts at 100, delivers 3 times the daily index return, and has no fees, financing costs, distributions, or tracking differences.
| 60-day path | Index return | Idealized 3x return |
|---|---|---|
| Steady: approximately +0.159% every day | +10.00% | +33.04% |
| Choppy: +4%, then approximately -3.540%, repeated 30 times | +10.00% | +3.20% |
To check the math for the first part, we can look at the constant return line. The daily index return is 1.10 ^ (1/60) or 1. Tripling that gives a daily wealth multiplier of (1 + 3a). For holding period return we'd cube that, so (1 + 3a)^60 or 1. This gives a final gain of 33.04% and not simply 3 times the 10% gain.[4]
For the choppy path, the second day’s return is b = 1.10^(1/30)/1.04, 1. Each two-day pair multiplies the index by 1.04 × (1 + b), but multiplies the idealized 3x investment by 1.12 × (1 + 3b). Do those 30 pairs of returns: the respective end value returns are [1.04 × (1 + b)]^30, 1 and [1.12 × (1 + 3b)]^30, 1. Use the formulas at full precision, not the rounded daily percentages in the table.[4]
The reset targets leveraged exposure relative to the fund’s updated value. After gains, subsequent percentage gains act on a larger base; after losses, the base is smaller. That’s why sustained gains can favorably compound, while repeated reversals can reduce the result at the same index endpoint. “Volatility drag” is the name for this mathematical phenomenon. It’s a characteristic of compounding and does not necessarily mean that leveraged exposure will always underperform.[2][4]
One thing to keep straight: just rearranging an identical set of daily returns will leave the idealized ending value the same. Ordering still changes interim drawdowns. That can affect your decisions to buy, sell, or trade. The example above changes the order of the daily returns.[4]
The arithmetic isn’t the whole fund return
TQQQ, for instance, is striving for 3x the daily performance of the Nasdaq-100, prior to fees and expenses. It isn’t purely a technology ETF. Its prospectus makes a distinction between operating expenses and other costs. The other costs and daily tracking differences are shown above the line and are additive to the compounding illustrated here.[2][3][6]
I don’t consider a fund’s failure to triple quarterly index gains a tracking failure. First, consider its daily NAV returns relative to its daily objective. Second, for holding-period performance, distinguish NAV from market returns and adjust for distributions; trading costs, execution prices, and slippage also matter. Last, consider a universe of matched data; the difference you can’t explain reliably reflects financing, trading, and other effects.[2][3][4]
“Technology will recover” leaves something unanswered
Consider another hypothetical calculation before costs: an index falls 10%, then gains 11.111…%, returning from 100 to 90 to 100. A 3x leveraged investment also starts at 100, then falls to 70, and then rallies to 93.33. The index was flat; the leveraged investment wasn’t. At a $10,000 starting capital level, that represents a $3,000 loss, not just a percentage loss.[4]
You can’t solve this mismatch with a universally defined holding period. Longer holding periods expose you to more daily compounding, and in that time an index could also move against you. You should expect the investment to navigate through the negative moves rather than just end at the destination.[1][5]
How long does your thesis need to play out? Does it still work under a choppy path after product costs, or only under steady gains? What dollar loss could the position produce along the way, and does your recovery assumption require the fund to regain its value merely because the index does?
Sources and references
- US Securities and Exchange Commission, Office of Investor Education and Advocacy: Updated Investor Bulletin: Leveraged and Inverse ETFs (2023-08-29)
- ProShares: UltraPro QQQ summary prospectus
- ProShares: TQQQ UltraPro QQQ product page
- SIAM Journal on Financial Mathematics; Marco Avellaneda and Stanley Zhang: Path-Dependence of Leveraged ETF Returns (2010-07-08)
- FINRA: The Lowdown on Leveraged and Inverse Exchange-Traded Products (2022-04-07)
- Nasdaq: Nasdaq-100 Index methodology
