
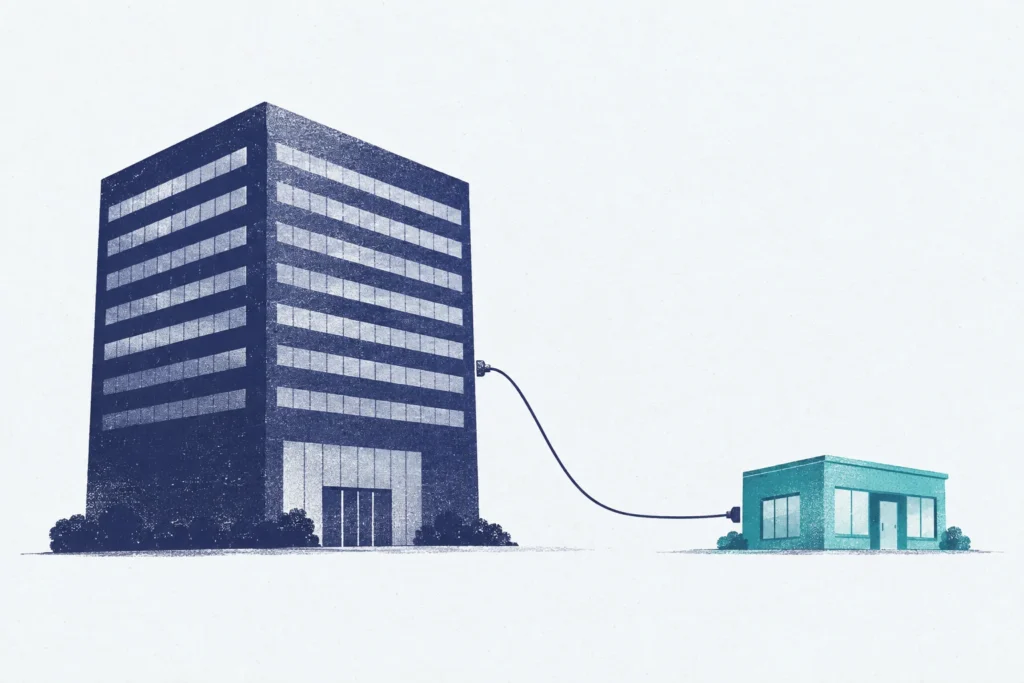
Customer concentration means your growth forecast depends disproportionately on particular buyers’ decisions. It calls for a conditional revenue-and-margin forecast, not an automatic haircut or a reason to reject the stock. I’d start with whose demand supports the sales, how freely that customer can change purchases, and which costs remain if orders fall.
Imagine I’m updating a spreadsheet with a tidy 20% growth assumption. Then a filing footnote sends me hunting through three sections: the biggest invoice recipients aren’t the companies choosing the product. I’m annoyed, not because concentration ruins the investment, but because my neat forecast hasn’t examined the decision that matters. I leave the growth cell alone for a moment and map who actually controls the purchases.
The invoice recipient may not own the demand
The end customer is the party that ultimately decides what is made. They may not be the recipient of a supplier invoice. For example, a contract manufacturer buys components to make a device for the end customer.[1][4]
For Cirrus Logic, it noted that approximately 91% of net sales for fiscal 2026 came from Apple through multiple contract manufacturers, and identified the end customer based on who specifies the component design. However, at year end, Foxconn and Luxshare accounted for 39% and 22% of gross trade receivables, respectively. There is no contradiction. One disclosure describes end customer demand for the year, and the other describes year-end accounts receivable. Neither percentage should be added to the 91% Apple figure.[1]
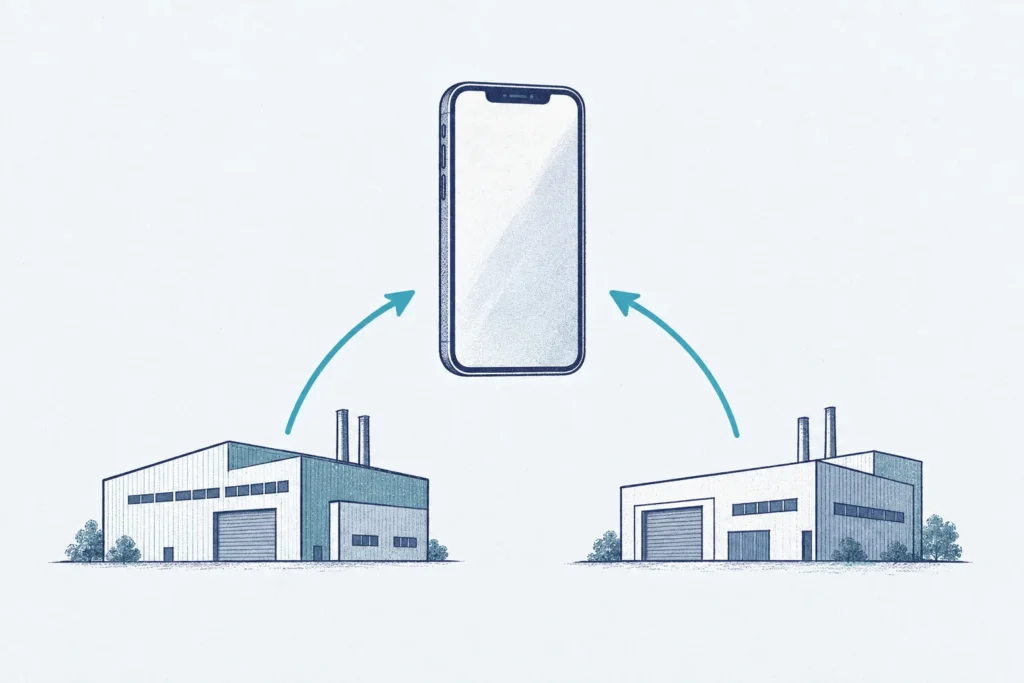
Receivables concentration gives information about who owes the money and where payment risk is concentrated. It is not the same as revenue concentration. When considering payment risk, other factors including the timing of shipments and the terms of sales may influence the collection of receivables. I would not consider either of these figures to answer the question about the other.[1]
The disclosure threshold isn’t a risk threshold
For public entities applying US GAAP, ASC 280 requires major-customer disclosure when a single external customer accounts for at least 10% of revenue. The disclosure includes the revenue amount and relevant segments, but need not name the customer. Entities known to be under common control are treated as one customer. That’s an accounting trigger, not a line separating acceptable and unacceptable investments.[2]
Economic dependence can also sit below that threshold. Several unrelated buyers may serve one downstream customer or rely on the same spending budget. NVIDIA’s quarter ended July 26, 2026 filing distinguishes direct from indirect customers and estimates that an AI research and deployment company’s cloud purchases from its customers contributed meaningfully to NVIDIA’s revenue. It supplies no percentage for that dependence. That’s a reason to investigate shared demand, not permission to guess the company’s identity or add an estimated exposure to direct-customer sales.[4]
A difficult switch doesn’t guarantee an order
I do give switching costs some consideration. This is particularly the case when a customer uses a proprietary component. This may prevent the customer from switching to a new supplier for some time. A customer's switching costs do not necessarily answer how many products a customer builds, or what price the customer may charge for those products. A prominent customer name may justify the answer to these questions, but not necessarily answer them.
Cirrus says its components are largely its own and unavailable from other sources. It also says most customer contracts were originally expected to last one year or less, customers generally can cancel or reschedule orders without significant penalties, and expenses are largely fixed in the short term. In subsequent quarterly filings, it says there are purchase minimums, pricing pressure, customized products, and wafer obligations through 2028. Cirrus notes also state product differentiation and purchasing flexibility exist together.[1][3]
A three-year agreement is more comforting than Cirrus disclosures, which focus on more general description of mechanisms, not specifics relating to Apple. Cirrus disclosures don’t describe minimum purchases, termination payments, or provisions, though it’s clear why such terms are important. Pricing can be reset, and both sides can be redesigned at certain times, at certain costs.[1][3]
A smaller order can cause a larger profit shortfall
A hypothetical model for the following year is more realistic than a current year estimate for either company. Cirrus says revenue was about $1 billion last year. Your estimate for this year is $1.2 billion, a 20% increase. One customer represents 25% of that $1.2 billion forecast, or about $300 million. A 30% shortfall on that forecast is a $90 million shortfall. Cirrus has no other customers to make up that shortfall. Total revenue for Cirrus is about $1.11 billion, and growth is about 11% for the year.
Use forecast revenue here, not historical revenue. Regarding profit, let’s say the lost sales eliminate $45 million of production costs, and all other production costs and operating expenses remain. Not having $90 million of revenue and saving only $45 million reduces operating profit by $45 million. I wouldn’t skip over the impact of committed capacity, depreciation, and the engineering staff. These costs and headcounts may remain, even if the orders are cancelled.
| Metric | Baseline | Purchase reduction | Reduction plus $15 inventory charge |
|---|---|---|---|
| Revenue | $1,200 | $1,110 | $1,110 |
| Growth over prior-year $1,000 | 20% | 11% | 11% |
| Cost of revenue | $720 | $675 | $690 |
| Gross profit | $480 | $435 | $420 |
| Gross margin | 40% | 39.2% | 37.8% |
| Operating expenses | $240 | $240 | $240 |
| Operating profit | $240 | $195 | $180 |
| Operating margin | 20% | 17.6% | 16.2% |
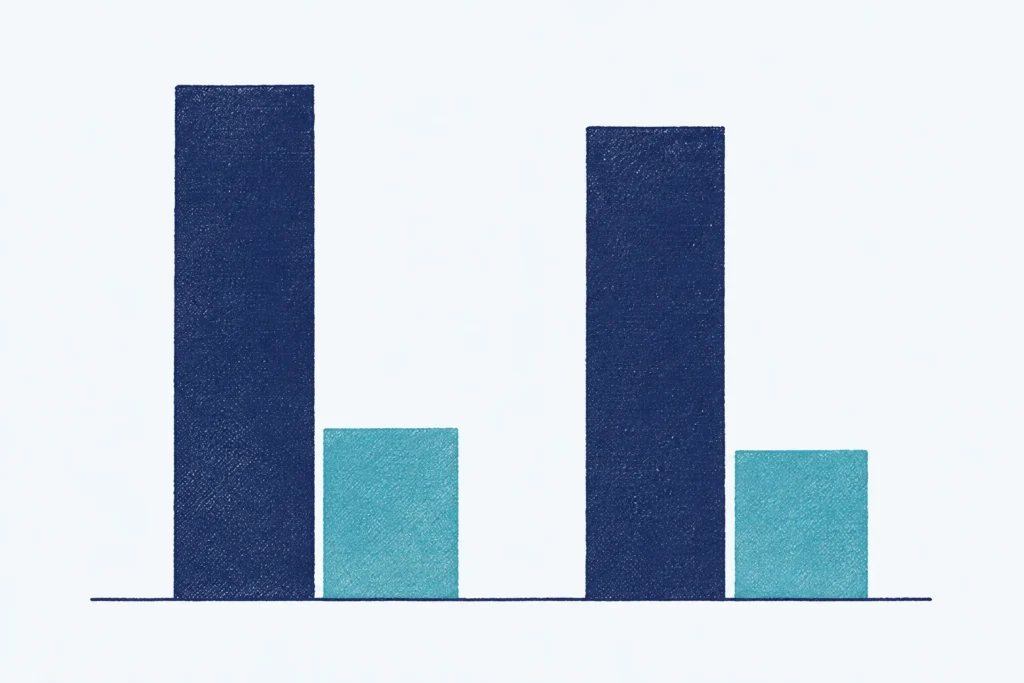
Revenue decreases by 7.5% from the baseline forecast, but operating profit decreases by 18.75% before considering any impact of inventory. A $15 million charge is optional and illustrates a customer-specific inventory write-down. Counting the same stranded costs twice would exaggerate the downside. Actual customer prices and marginal costs are not disclosed, and therefore, we need to keep our assumptions hypothetical.
Change the scenario when the purchasing decision changes
An order deferral may mean a loss this year and a recovery next. A permanent loss requires a different recovery path. An order change may mean the end customer demand is met by a different distributor. Price reductions by a competitor may result in a loss of order volume. I wouldn’t run those through the same lost-volume assumption.
Replacement sales should be shown in the period in which they should realistically occur, at their expected price, and contribution margin. New customers should be qualified, and have complementary products in demand. Not all customer-specific output is replaceable, and Cirrus, explicitly states this. Idle capacity does not equal replacement sales.[3]
Binding purchase minimums would give more confidence to the near-term volumes. While an order redesign or a later renewal date could push the exposure out further, qualified replacement demand could minimize the loss. Until replacement demand is qualified and proven, don’t simply substitute replacements sales to fill the gap. In the example provided, a 17.6% operating margin would be required to support a 11% growth in sales, as opposed to the prior 20% and 20%. Your company’s downside would depend on its own purchase terms and cost.
Sources and references
- Cirrus Logic / SEC EDGAR: Cirrus Logic FY2026 Form 10-K (2026-05-21)
- Deloitte Accounting Research Tool: ASC 280-10-50-42 excerpt and major-customer discussion
- Cirrus Logic / SEC EDGAR: Cirrus Logic quarter ended June 27, 2026 Form 10-Q (2026-08-05)
- NVIDIA / SEC EDGAR: NVIDIA quarter ended July 26, 2026 Form 10-Q
