

An increased operating margin deserves a place in your forecast when you can explain the source of the increase and it survives normal growth-related spending. Determine how the company has improved gross margin in each category of operating expenses and investigate the reason. I wouldn’t count a pause in hiring as a permanent increase in productivity. However, I wouldn’t ignore a true restructuring of costs.
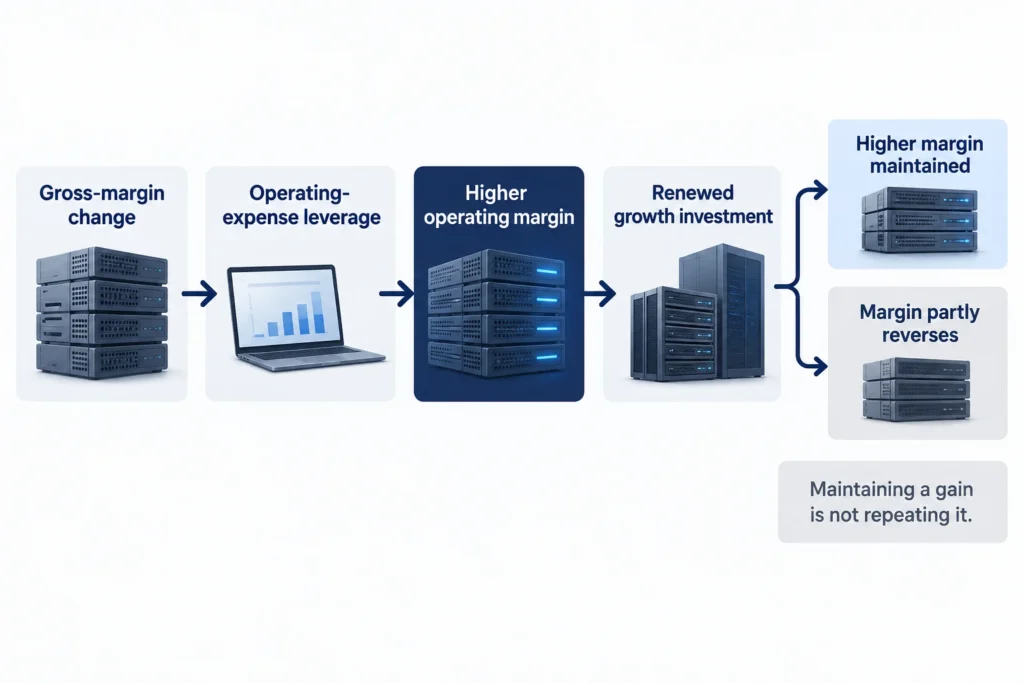
There is another difference that is just as important: lasting a higher margin doesn’t mean a company can achieve an even greater expansion of margin next year. There are some true restructuring costs that the company can’t eliminate or reduce twice. This is where a reasonable profitability assumption can become an unreasonable valuation assumption.
Locate the improvement before explaining it
The income statement provides the starting point to calculate operating margin. Operating margin is equal to gross margin less operating expenses as a percentage of revenue. I would use the comparable annual GAAP numbers over a few years before considering adjusted numbers. For each expense category, determine the difference between its old and new revenue percentage and attribute the difference to gross margin improvement.
| Income-statement item | Year 1 | Year 2 | Contribution to margin change |
|---|---|---|---|
| Revenue | $1,000 | $1,200 | , |
| Gross profit | $700 / 70% | $864 / 72% | +2.0 percentage points |
| R&D | $120 / 12% | $138 / 11.5% | +0.5 percentage point |
| Sales and marketing | $140 / 14% | $162 / 13.5% | +0.5 percentage point |
| G&A | $40 / 4% | $48 / 4% | 0.0 percentage point |
| Operating income | $400 / 40% | $516 / 43% | +3.0 percentage points total |
Notice that every expense category increased in dollars; R&D and selling costs simply grew more slowly than revenue. Calling this a spending cut would misread the business. Of the three-point margin gain, two points came from gross profit and one from lower operating-expense intensity. You now have two different things to investigate: why delivering revenue became more profitable, and why revenue outgrew the operating organization.
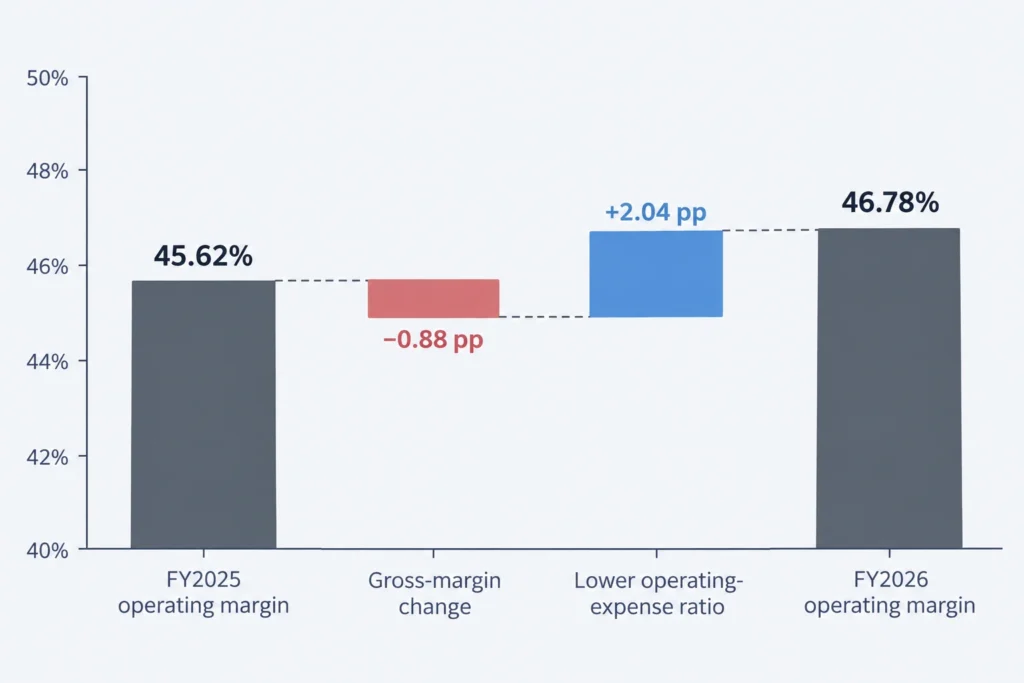
Microsoft’s FY2026 earnings release shows why that separation matters. From its reported, unaudited annual figures, I calculate that gross margin fell from 68.82% to 67.94%, while the operating-expense ratio fell from 23.20% to 21.16%. Operating margin rose from 45.62% to 46.78%: a roughly, 0.88-percentage-point gross-margin contribution was more than offset by +2.04 points from lower operating-expense intensity. The arithmetic locates the improvement, but doesn’t tell us why it happened or whether it will last.[1]
The same percentage can hide different businesses
A gross-margin gain might come from higher prices, lower delivery costs, better capacity utilization, or a shift toward higher-margin products. I’d be more willing to carry a lasting reduction in hosting cost per workload into a forecast than a temporary surge in premium-product sales. Segment disclosures and management’s discussion help you distinguish those explanations. A favorable mix shift can lift the consolidated margin even while an individual business deteriorates.
The expenses side warrants the same level of scrutiny. Selling costs can be reduced relative to sales because it takes less effort to sell to renewing customers as opposed to new customers. New customer acquisition can also slow, for example due to a shift in marketing strategy. Lower R&D costs can be due to retired, redundant products or a delayed product release. A hiring freeze can mean necessary work is backlogged. The reduction in costs alone does not warrant a conclusion. Assuming underinvestment is as careless as assuming productivity.
Box’s quarter ended July 31, 2026 shows why I read the functional explanations rather than assigning one slogan to the whole company. Its R&D growth included a 6% headcount increase, partly offset by $4.0 million of higher software capitalization. Its G&A decline primarily reflected lower stock compensation and workforce-reorganization expenses. Sales-and-marketing headcount increased while that function’s revenue percentage fell. Similar-looking expense ratios had different causes.[2]
Efficiency has to survive the work
Picture me, in an imagined spreadsheet session, copying a lower selling-cost ratio into next year’s forecast. However, upon review of the explanations, I discover the sales positions were left open. I then get annoyed for taking a shortcut. To budget for the various alternatives, I would need to establish if the company has the capacity to win the next group of customers.
I would feel better if we resumed necessary hiring, products shipped, and customer outcomes remained the same while expense growth did not eat into the margin gains. Useful clues depend on where the savings occurred. For R&D, savings could be in product delivery and adoption. For the sales function, savings could be in new customer wins and in acquisition productivity. For customer-facing operations, savings could be in retention and in service quality and support capacity. Total headcount would not be that useful as one could be adding engineers while removing administrative staff.
The challenging part is that impacts can happen long after the cost saving measures. Annual renewals may initially conceal weaker support, and a long product cycle may conceal the impact of reducing development. So, the next earnings release may not be sufficient, and we may need to rely on other filings and outcomes during the relevant contract, or product cycle. If management relies on automation to explain savings, and does not provide data or operating evidence to support this, I would consider this an unproven hypothesis. A story that sounds good may not be a true measured benefit.
Accounting can change the comparison
Capitalization is a good transitional point, because not all development spending that is capitalized and recorded as an asset becomes an expense in the current period, and there can be amortization in later periods. Therefore, if we see a sudden drop in expense ratio, with certain cost saving measures and automation, we may need to look at policies, and see if there has been any change in amortization policies. Box's automation may give a reason to look at the timing, but it may not be an indicator of improper accounting.[2]
Separate treatments for GAAP and adjusted margins are also required. Salesforce’s August 26, 2026 full-year guidance reconciliation added 4.4 points of purchased-intangible amortization, 9.0 points of stock compensation, and 0.8 point of restructuring and acquisition-related costs to a 20.1% GAAP margin, reaching 34.3% non-GAAP. Those were forecast margins, not actual margins. I don’t consider a disappearing charge, like restructuring, an example of repeatable operational efficiency, nor would I interpret an employee cost saving as an example of employee compensation becoming economically irrelevant.[3]
In considering AI products, local cross-checks entail analyzing unit level costs (if disclosed) and evaluating how unit-level costs change with the level of usage of the product or service. Operating cost savings can be achieved at the expense of a gross margin, and vice-versa.
What the growth budget does to your forecast
For our hypothetical company, suppose next-year revenue grows 10% to $1,320 million and gross margin stays at 72%. That produces $950.4 million of gross profit. A 43% operating margin requires $567.6 million of operating income, leaving $382.8 million for operating expenses: $950.4 million minus $567.6 million. So your forecast allows expenses to grow 10% from $348 million, but no faster than revenue.
Now let's look at an expanded budget. Let's say there is 20% growth in hiring and investment, which increases R&D and selling expenses to $165.6 million and $194.4 million, respectively, and increases G&A to $49.2 million. Total expenses increase to $409.2 million, leaving $541.2 million of operating income and a 41% margin. That's $26.4 million less profit than the 43% forecast, and not a decline from Year 2's profit. These are illustrative budgets and not a projection from the company. Keeping gross margin at 72% isolates the operating-investment question rather than showing whether the gross-margin expansion will last.
I want that assumption made explicit before trusting the valuation: is it actually possible to fit the growth plan within $382.8 million? If the evidence supports a $409.2 million budget, you have to reflect that in your profit forecast. Public disclosures may not clarify the spending requirement, and in that case, you should consider both scenarios in your model. Additionally, expanding margin requires an additional source of savings rather than another round of last year's cost reset.
Sources and references
- Microsoft: Microsoft FY2026 fourth-quarter and full-year earnings release
- Box; filed with the US Securities and Exchange Commission: Box Form 10-Q for the quarter ended July 31, 2026
- Salesforce: Salesforce second-quarter fiscal 2027 results and reconciliations (2026-08-26)
