
When comparing cash conversion to earnings, explain the differences across various matching periods rather than saying the larger number is correct. Cash conversion begins with consolidated GAAP net income and reconciles it with operating cash flow and separately accounts for investment payments that are excluded in operating cash flow. I would change a forecast only after determining if the difference reflects collection timing, reoccurring economic costs, or a change in the funding needs.
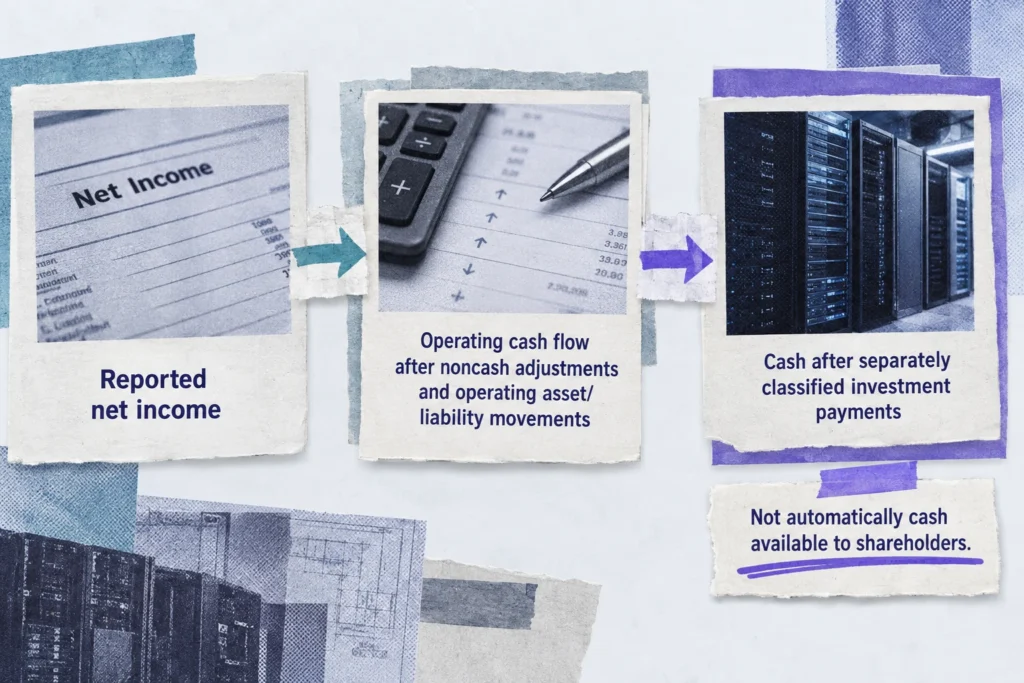
Imagine I'm at the kitchen table with a printed filing, trying to fit “cash available” in the margin next to operating cash flow. Annoyed with myself for using that label, I cross it out and continue reading. Real cash exists, but the claim hasn’t been completely settled.
One business, three years, every adjustment
Salesforce offers a 3-year comparative view and, unlike most reports, does not switch to a different business model halfway through the reporting period. The consolidated GAAP dollars, not EPS or adjusted earnings, are shown for fiscal years ending January 31. The net operating asset and liability changes are reported. Read each positive sign as an increase in cash relative to earnings and each negative sign as a decrease.[1]
| Reported amount or adjustment | FY2024 | FY2025 | FY2026 |
|---|---|---|---|
| Net income | 4,136 | 6,197 | 7,457 |
| Depreciation and amortization | +3,959 | +3,477 | +3,631 |
| Amortization of capitalized contract costs | +1,925 | +2,095 | +2,197 |
| Stock-based compensation | +2,787 | +3,183 | +3,509 |
| Strategic-investment adjustment | +277 | +121 | , 1,017 |
| Accounts receivable | , 659 | , 490 | , 2,160 |
| Capitalized contract costs | , 1,872 | , 2,121 | , 2,811 |
| Prepaid expenses and other assets | , 843 | , 1,495 | +819 |
| Accounts payable, accrued expenses, and other liabilities | , 478 | +1,089 | +1,014 |
| Operating lease liabilities | , 621 | , 548 | , 567 |
| Reported amount or calculation | FY2024 | FY2025 | FY2026 |
|---|---|---|---|
| Unearned revenue | +1,623 | +1,584 | +2,924 |
| Operating cash flow | 10,234 | 13,092 | 14,996 |
| Operating cash flow ÷ net income | 2.47× | 2.11× | 2.01× |
You can check FY2026 directly: 7,457 + 3,631 + 2,197 + 3,509-1,017-2,160-2,811 + 819 + 1,014-567 + 2,924 = 14,996. If your spreadsheet groups prepaid assets, payables-and-accruals, and lease liabilities as “other operating adjustments,” those subtotals are, 1,942, 954, and +1,266. I’d keep the three component rows visible. Otherwise, the tidy label hides what actually changed.[1]
Conversion falls from 2.47× to 2.01× even though operating cash flow rises every year: earnings grew faster. Across the full period, 38,322 ÷ 17,790 = 2.15×, using the ratio of sums rather than an average of annual ratios. That’s useful context, not a passing grade. I wouldn’t downgrade the business merely because the ratio fell, or congratulate it merely because cash exceeded earnings.[1]
A balance can reverse without the funding need disappearing
Adjustments to receivables in FY2026 reduce conversion by $2,160 million and increase it by $2,924 million by unearned revenue. Looking only at the first line would provide an incomplete view of the billing. Salesforce generally invoices annually with 30-day payment terms, and an invoice can create both a receivable and unearned revenue before service revenue is recognized. A growing balance in accounts receivable does not indicate that customers are past due.[1][2]
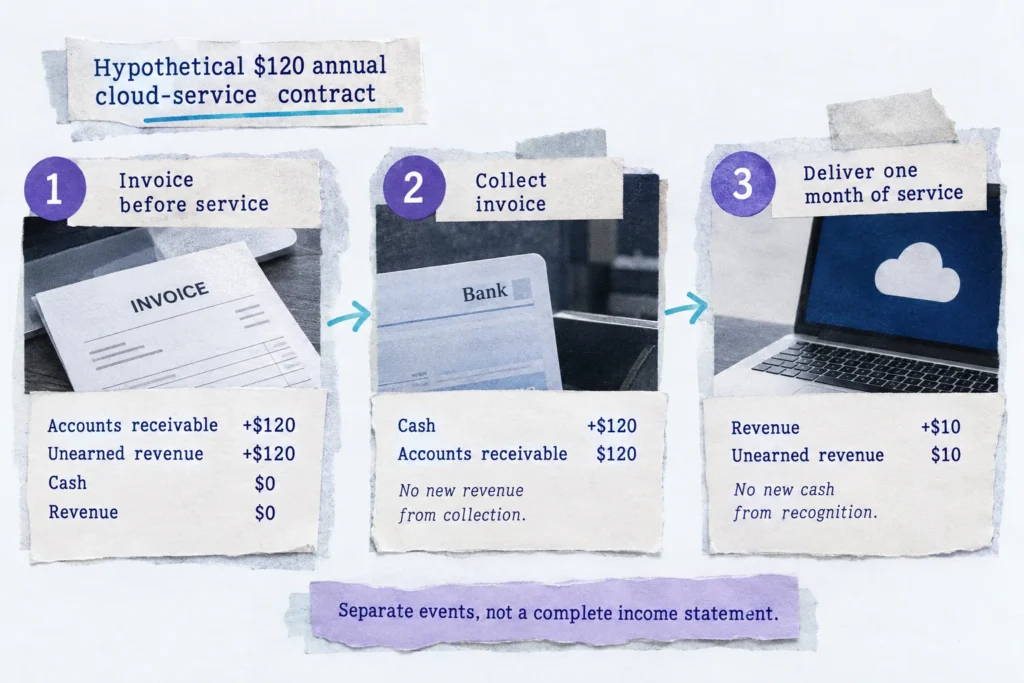
One receivable can be collected while many new receivables remain and push the total receivable balance higher. The old balance reverses, but a new, larger balance may need to be funded. So, it may reverse, but it may not reflect an improvement in cash flow from ops. You may have a collection problem where the cash is tied up for a long time and credit losses may occur. Only the credit losses mean the cash will not be collected.
I would require longer payment terms, more delinquency, larger provisions for credit losses and increased write-offs, and disclosed collection problems before concluding collection deterioration. Salesforce’s credit-loss assessment considers delinquency and takes into account the economy, but the disclosures do not provide us with subsequent collections at the invoice level, if there are any, and do not provide complete aging. Thus, the limitations are on the conclusions, not the usefulness of the bridge. For a more detailed analysis of the clues, refer to [What Does a Technology Company’s Rising Accounts Receivable Tell Investors About Revenue Quality?](https://investortechtalk.com/tech-company-rising-accounts-receivable-revenue-quality/).[2]
An add-back isn’t a disappearing cost
Salesforce excludes $3,509 million of stock-based compensation from FY2026 operating expenses, because the expense did not require an equivalent cash outflow. Employees were still compensated with shares. I don’t believe one should let that accounting adjustment lead to an assumption of free labor. Treat the adjustment consistently and show the burden on the income statement. For an explanation of the modeling option, see [How Should Investors Account for Stock-Based Compensation?](https://investortechtalk.com/stock-options-restricted-stock-earnings-shareholder-value/).[1]
Contract acquisition costs make the timing difference especially easy to see. In FY2026, the $2,197 million amortization add-back sits alongside a, $2,811 million capitalized-cost adjustment: 2,197-2,811 =, 614 million. The net effects were +$53 million in FY2024 and, $26 million in FY2025. Salesforce generally amortizes new-contract acquisition costs over four years, so the expense and cash cost arrive on different schedules. Neither side of the bridge tells the whole story alone.[1]
These costs are contract acquisition costs, and not capitalized software costs. The cash effect of these costs is reflected in operating cash flow. Therefore, these costs should not be considered when calculating cash after investment.[1]
I wouldn’t use the $3,631 million depreciation and amortization add-back to make a replacement-spending budget, either. Salesforce lumped amortization of acquired intangibles and right-of-use assets together with amortization and impairment. Those are distinct charges in accounting and don’t mean that each dollar needs to be offset by a dollar of future capex.[1]
Why the latest quarter looks different
The latest reported quarter (October 7, 2026 research cutoff) was Salesforce’s fiscal Q2 2027, ending July 31, 2026. Net income was $3,526 million and operating cash flow was $1,269 million. The bridge shows $2,613 million strategic investment adjustment. That alteration affects how I evaluate the gap. Investment income or gains, in essence, are not customer cash collections. Management’s adjusted net income also retains strategic investments, and therefore, the “adjusted” moniker doesn’t address this specific case.[2][3]
Extend the period to six months and net income was $5,633 million versus $7,970 million of operating cash flow. Receivables increased by $8,035 million and unearned revenue increased by $5,576 million, compared with $6,349 million and $4,188 million, respectively, in the prior year. Timing of billings and collections need to be studied to determine why certain receivables aren’t collected in the same accounting period, and shouldn’t be treated as evidence of deterioration.[2]
What you can carry into a forecast
Operating cash flow still exceeds investment payments classified elsewhere. Salesforce defines free cash flow as operating cash flow less capital expenditures, giving a cash flow of $14,996 million for FY2026, $594 million = $14,402 million. Another $584 million of reported principal payments on financing obligations reduces the number to $13,818 million. The second number is a subtotal, not complete distributable cash, and not a claim that every principal payment on financing obligations is maintenance capex.[1][3]
Free cash flow, as defined by Salesforce, is impressively labeled; however, subtraction is clearer. The SEC advises that labeling free cash flow, or similar terms, does not imply discretionary cash when mandatory payments are still excluded. Here, we don’t have a clear-cut maintenance/growth investment split. I’d keep reported spending in the base forecast and label alternative spending assumptions as scenarios, rather than say we have measured sustainable cash for shareholders. [Why Can a Tech Company's Free Cash Flow Look Strong While Investment Needs Rise?](https://investortechtalk.com/tech-free-cash-flow-rising-investment-needs/) discusses the obligations that a headline subtotal can miss.[1][4]
When the data shows slower timing, adjust collection dates forecasted to be further out. If replacement balances absorb more cash per dollar of business, increase ongoing working capital needs, instead, of adjusting collection dates. Adjust collection dates only if there is evidence of credit loss. Changes made to a cash-flow projection, like moving collection dates out, and changing ongoing working capital needs, have different implications.
Keep recurring compensation and contract acquisition spending in the economics, and move long-run cash generation when required investment and recurring funding needs rise. I’d want the forecast to reveal cash payments that operate between operating cash flow and shareholders, as well as what is continually returning, and what will reverse. I am not inclined to believe a gap in the conversion ratio, by itself, implies there has been accounting misconduct.
Sources and references
- Salesforce, Inc.; filed with the SEC: Salesforce fiscal 2026 Form 10-K (2026-03-02)
- Salesforce, Inc.; filed with the SEC: Salesforce Form 10-Q for July 31, 2026
- Salesforce, Inc.: Salesforce second-quarter fiscal 2027 earnings release (2026-08-26)
- U.S. Securities and Exchange Commission: Non-GAAP Financial Measures C&DIs, Question 102.07
