
Find the metric that shows the improvement in revenue less serving costs for comparable workloads. Ask if that improvement covers capacity, development, and other operating costs. The first metric shows the improvement of serving economics. The second shows fully burdened profitability. I’d credit increasing usage as evidence of demand, but I would not increase your long-term margin expectation until price and cost evidence warrant it.
Imagine I am listening to an earnings webcast with my lunch. Usage has doubled and I am writing “higher margins” in the margin. I notice there is no realized price, so I cross it out and write “more demand”. That is the evidence the case supports.
Start with what the customer actually pays
Inference is the work a trained model performs to arrive at an answer or prediction. A short answer can justify a long document that contains extensive reasoning and cost a lot. You need matched revenue and costs for comparable model quality, length of input and output, response time, and billing terms. Without these, changes in what customers request can look like changes in profitability.
I want the price customers pay instead of the pretty API price list. Discounts, credits, and incentives can change how much revenue a company realizes. So can the service promise. OpenAI’s Batch API documentation states that customers can get a 50% discount if they’re OK with a 24-hour turnaround time for asynchronous processing. Customers expect a more or less immediate response time. That discount tells nothing about OpenAI’s serving costs or margins.[4]
It matters who sells the service. A model provider that sells API access has to recover costs for serving and recover costs for developing the model. A cloud host that sells the service has to recover costs for the infrastructure. Amazon Bedrock illustrates these differences through token-priced and provisioned-throughput services, and terms vary by the model and option.[5]
An application vendor is on the other side of that API bill. A lower API price allows the vendor to lower the price for their subscription or task-based service and puts pressure on their supplier. But if customers don’t pay for more expensive requests, the vendor can have flat revenue and a rising bill from their supplier. This is why I resist margin rankings that position model providers, cloud hosts, and application vendors in the same column. The costs and who absorbs them are different.
Cheaper serving can still leave less profit
I've estimated sensitivity here, not a company estimate. Units are interchangeable and represent the same workload and level of service. Serving cost comprises usage-priced rented infrastructure and variable operating expenses. It does not include development and other fixed operating expenses. Let's assume those fixed expenses are $300 and there are no additional capacity commitments.
| Metric | Starting period | Changed period |
|---|---|---|
| Comparable workload units | 100 | 200 |
| Realized revenue per unit | $10.00 | $6.00 |
| Serving cost per unit | $6.00 | $4.20 |
| Contribution per unit | $4.00 | $1.80 |
| Total revenue | $1,000 | $1,200 |
| Total contribution | $400 | $360 |
| Contribution margin | 40% | 30% |
| Operating profit after $300 fixed expenses | $100 | $60 |
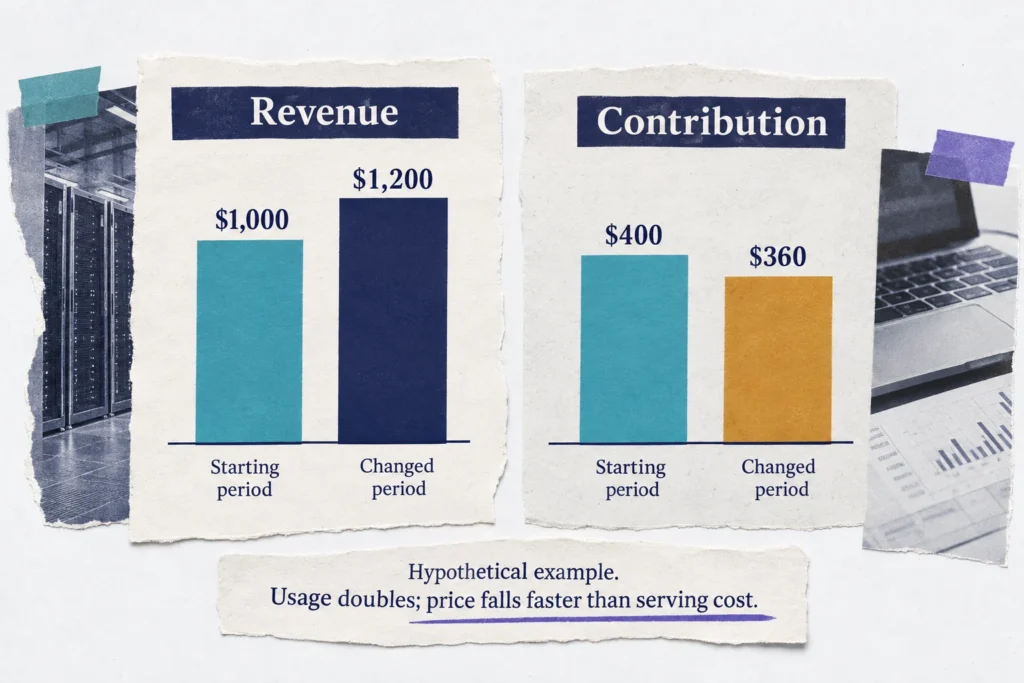
Revenue rises 20%, yet contribution falls 10%. The engineers' cost improvement is real; it just doesn't keep pace with the price cut. To preserve the original $400 contribution, you need about 222.2 units, calculated as $400 ÷ $1.80, approximately 2.22 times starting volume, not twice. That's the assumption I'd keep beside a growth forecast. If expansion also requires more fixed capacity or support, even that volume won't preserve operating profit.
A busy GPU isn't necessarily earning its keep
There is serving software that can give us more useful work from the same hardware. PagedAttention research focuses on eliminating waste in the KV cache, the memory that holds previously computed attention information. I take that very seriously. It does not, however, inform us about a public company's cost for a paid request.[6]
As a customer, you can recognize a catch: batching together more requests may increase total throughput, but can also make each person wait longer. MLCommons' endpoint methodology studies throughput, concurrency and response times, including time to first token. As an investment analysis, I would use the operating point that meets the customer’s response time requirement, not the throughput endpoint that is maximum.[7]
Useable capacity has costs. Peaking benefits won't show you unbilled work, idle time, or capacity set aside for load spikes. The question is: how much savings remain after efficiencies are used to provide longer or faster services? The business question is: how much savings remains after price cuts? The question is not whether the capacity exists.
Where the equipment bill belongs
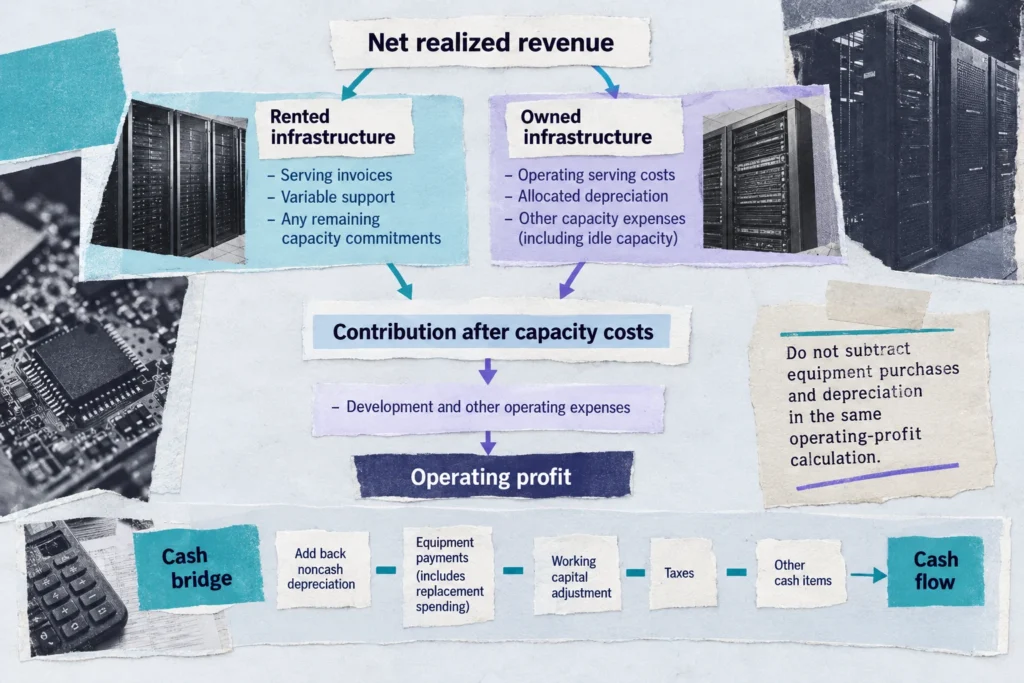
When you see "contribution," the question is: what have already been subtracted? If there is Rented Infrastructure, the answer is the serving invoice. You need to add visibility on any minimum commitments and unused reserved capacity. The equipment supplier is already bearing the burden of the equipment. Adding an imagined depreciation charge would double-count the burden.
With owned equipment, costs of one more request may be minimal, and support may cover the cost of the equipment, but capacity costs remain, and should be part of the profitability analysis. It's the same with research, development, sales, and general and administrative costs. They should be reported and counted only once.
Microsoft's disclosures show why the distinction matters
For the June 2026 quarter, Microsoft's investor metrics, reported 43% growth in Azure and other cloud services revenue. Microsoft cloud gross margin was 65%, down from 68% the year before. Those numbers reflect strong growth for broad cloud services and a decreasing gross margin for cloud, but the product groupings may differ. The numbers aren't a matched inference for revenue and costs.[2]
As reported by Intelligent Cloud, the revenue and operating income for the segment were $39.306 billion and $15.955 billion, respectively. Dividing the operating income by revenue gives approximately 40.6%. This is the operating margin of the segment, not an inferrence of Microsoft's operating margin, and shouldn’t be compared to Microsoft Cloud’s gross margin.[1][2]
Management said margin pressure was due to business mix, mainly from AI infrastructure and increased product usage, offset partially by efficiency gain. Regarding GitHub Copilot, management said increased usage negatively affected segment gross margins and said margins improved during the quarter after the usage based pricing change. The monetization effort shows an improvement in segment margin. It doesn’t isolate the effect of pricing or provide the gross margin for Copilot.[3]
The earnings releases, metrics definitions, and transcripts used herein, don’t provide a standalone Inference Income Statement or a matched series of realized prices, workload mix, and allocated costs. I can’t estimate those missed numbers by using broader figures. Those disclosures show profitable segments and AI-related pressures, but not standalone inference profitability.[1][2][3]
I’d lower your long-term margin assumption in light of comparable realized prices and workloads with improving contribution and capacity and Opex absorbtion. If those figures remain undisclosed, I’d maintain several margin scenarios vs. quietly borrowing a mature software margin. Missing disclosure doesn’t prove unprofitability of the business. It means you don’t have the evidence to pay for prosperous scale as though it’s confirmed.
Sources and references
- Microsoft: Microsoft FY2026 Q4 earnings release and financial statements (2026-07-29)
- Microsoft: Microsoft FY2026 Q4 investor metrics (2026-07-29)
- Microsoft: Microsoft FY2026 Q4 earnings conference call (2026-07-29)
- OpenAI: OpenAI Batch API documentation
- Amazon Web Services: Amazon Bedrock pricing
- Kwon and coauthors; SOSP 2023: Efficient Memory Management for Large Language Model Serving with PagedAttention (2023-09-12)
- MLCommons: MLPerf Endpoints benchmark methodology
